
Unlock the potential of your data and make better decisions - I turn a mess in spreadsheets into something you actually use.
Got data scattered across five spreadsheets, reports you assemble by hand every month, or numbers that tell you nothing? That is my thing.
I organize data, automate reports and build dashboards that actually say something - so you make decisions based on numbers, not gut feeling.
A concrete scope - no hidden asterisks or surprises.
Interactive reports that show what really matters - updated automatically.
I organize, clean and analyze data so you can actually draw conclusions from it.
No more manual copying - spreadsheets that update themselves (Apps Script).
I turn tables into clear charts and stories you can see and understand at a glance.
These are the tools I work with every day. If your data lives somewhere else - I am not afraid of new tools and get up to speed fast.
I quote every project individually - tidying up one spreadsheet is a different story than a dashboard tying several sources together. My rate starts at PLN 130 net/h.
When the scope is not clear yet or the data may change. You pay for the time actually worked - flexibly.
When the project is well defined. You know the cost upfront, no surprises.
Not sure which fits? Write to me - I will advise after a short talk.
You tell me what you have and what you need to find out. The rest is on me.
We define what the report should show and how long it will take. Straight up, no fluff.
I clean the data, build the analysis or dashboard, and show progress along the way.
I teach you how to use it and stay in touch in case something needs changing.
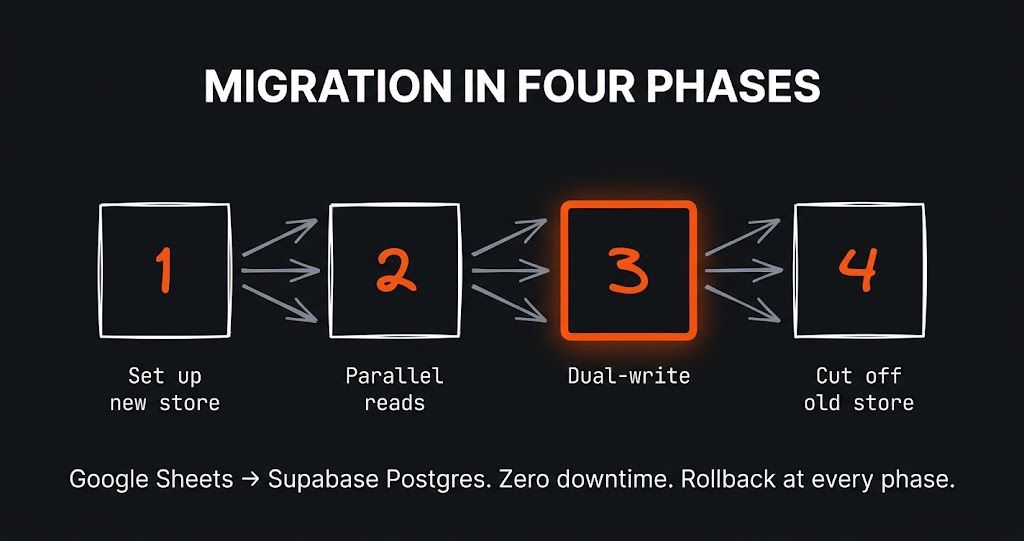
The challenge The app had grown alongside the business for a year and a half. It started as a clever Google Sheet with a few scripts…
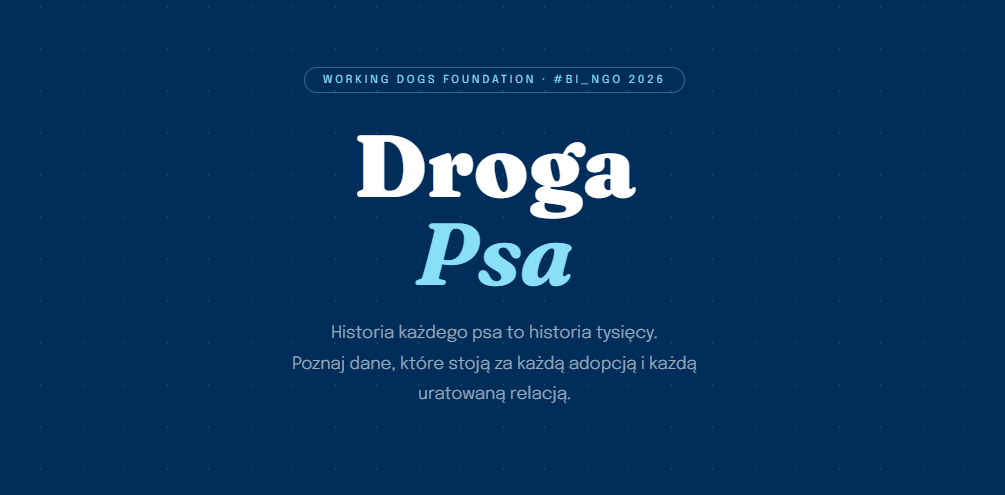
The challenge How do you present data about dog homelessness so that people actually want to read it? That was my challenge. In March…
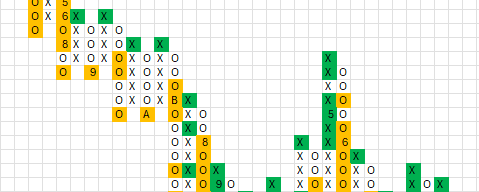
The challenge Picture a stock market analyst and his most precious tool – a proprietary method for analysing companies, refined over years. Now picture…
Współpraca na wysokim poziomie, dane wprowadzane na bieżąco, arkusze ulepszane w celu lepszej optymalizacji korzystania. Szczerze polecam
Just tell me what you need - it does not have to be technical, that is my job. I will get back to you and tell you straight whether and how I can help.