
Wikimedia Polska (#BI_NGO volunteering) · Foundation / NGO
Wikimedia Polska is celebrating the 25th anniversary of Polish Wikipedia and, as part of the #BI_NGO initiative, opened its historical data to volunteers. On the table were eleven years of pageview statistics: 126 consecutive months, split across desktop, mobile web and the app.
The first thing that jumps out of data like this is seasonality. January high, July low, year after year. I charted it, looked at it and decided it was not enough. Anyone who has been to school knows people read encyclopedias less during the holidays. That is not a discovery, it is a confirmation of intuition.
So I went looking for something the numbers do not show at first glance.
I started with a question that seemed simple: if traffic is falling, is Wikipedia losing readers, or are there simply fewer of us? Poland’s population has been shrinking for years, so it is a fair question.
I pulled two World Bank indicators through their API: Poland’s population and the share of people using the internet. Then I divided Wikipedia traffic by each of them.
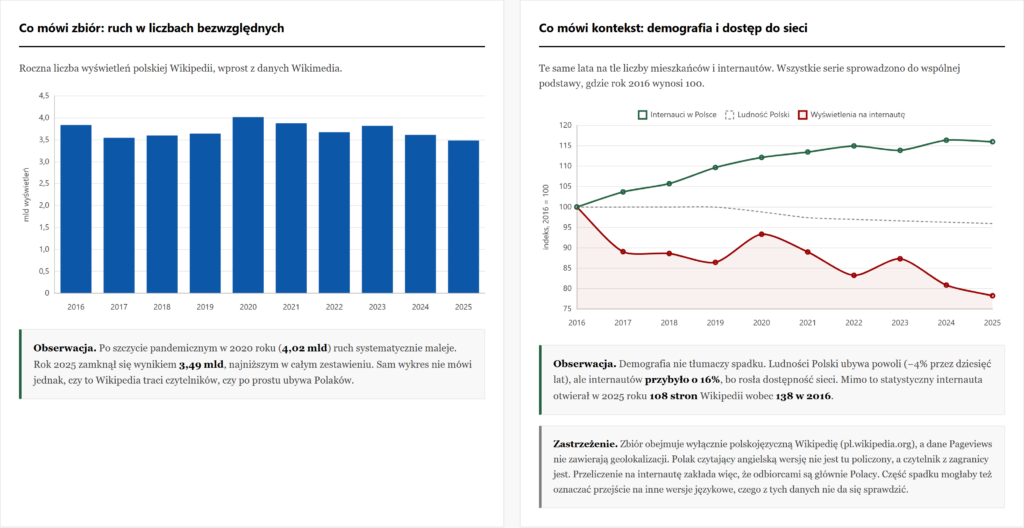
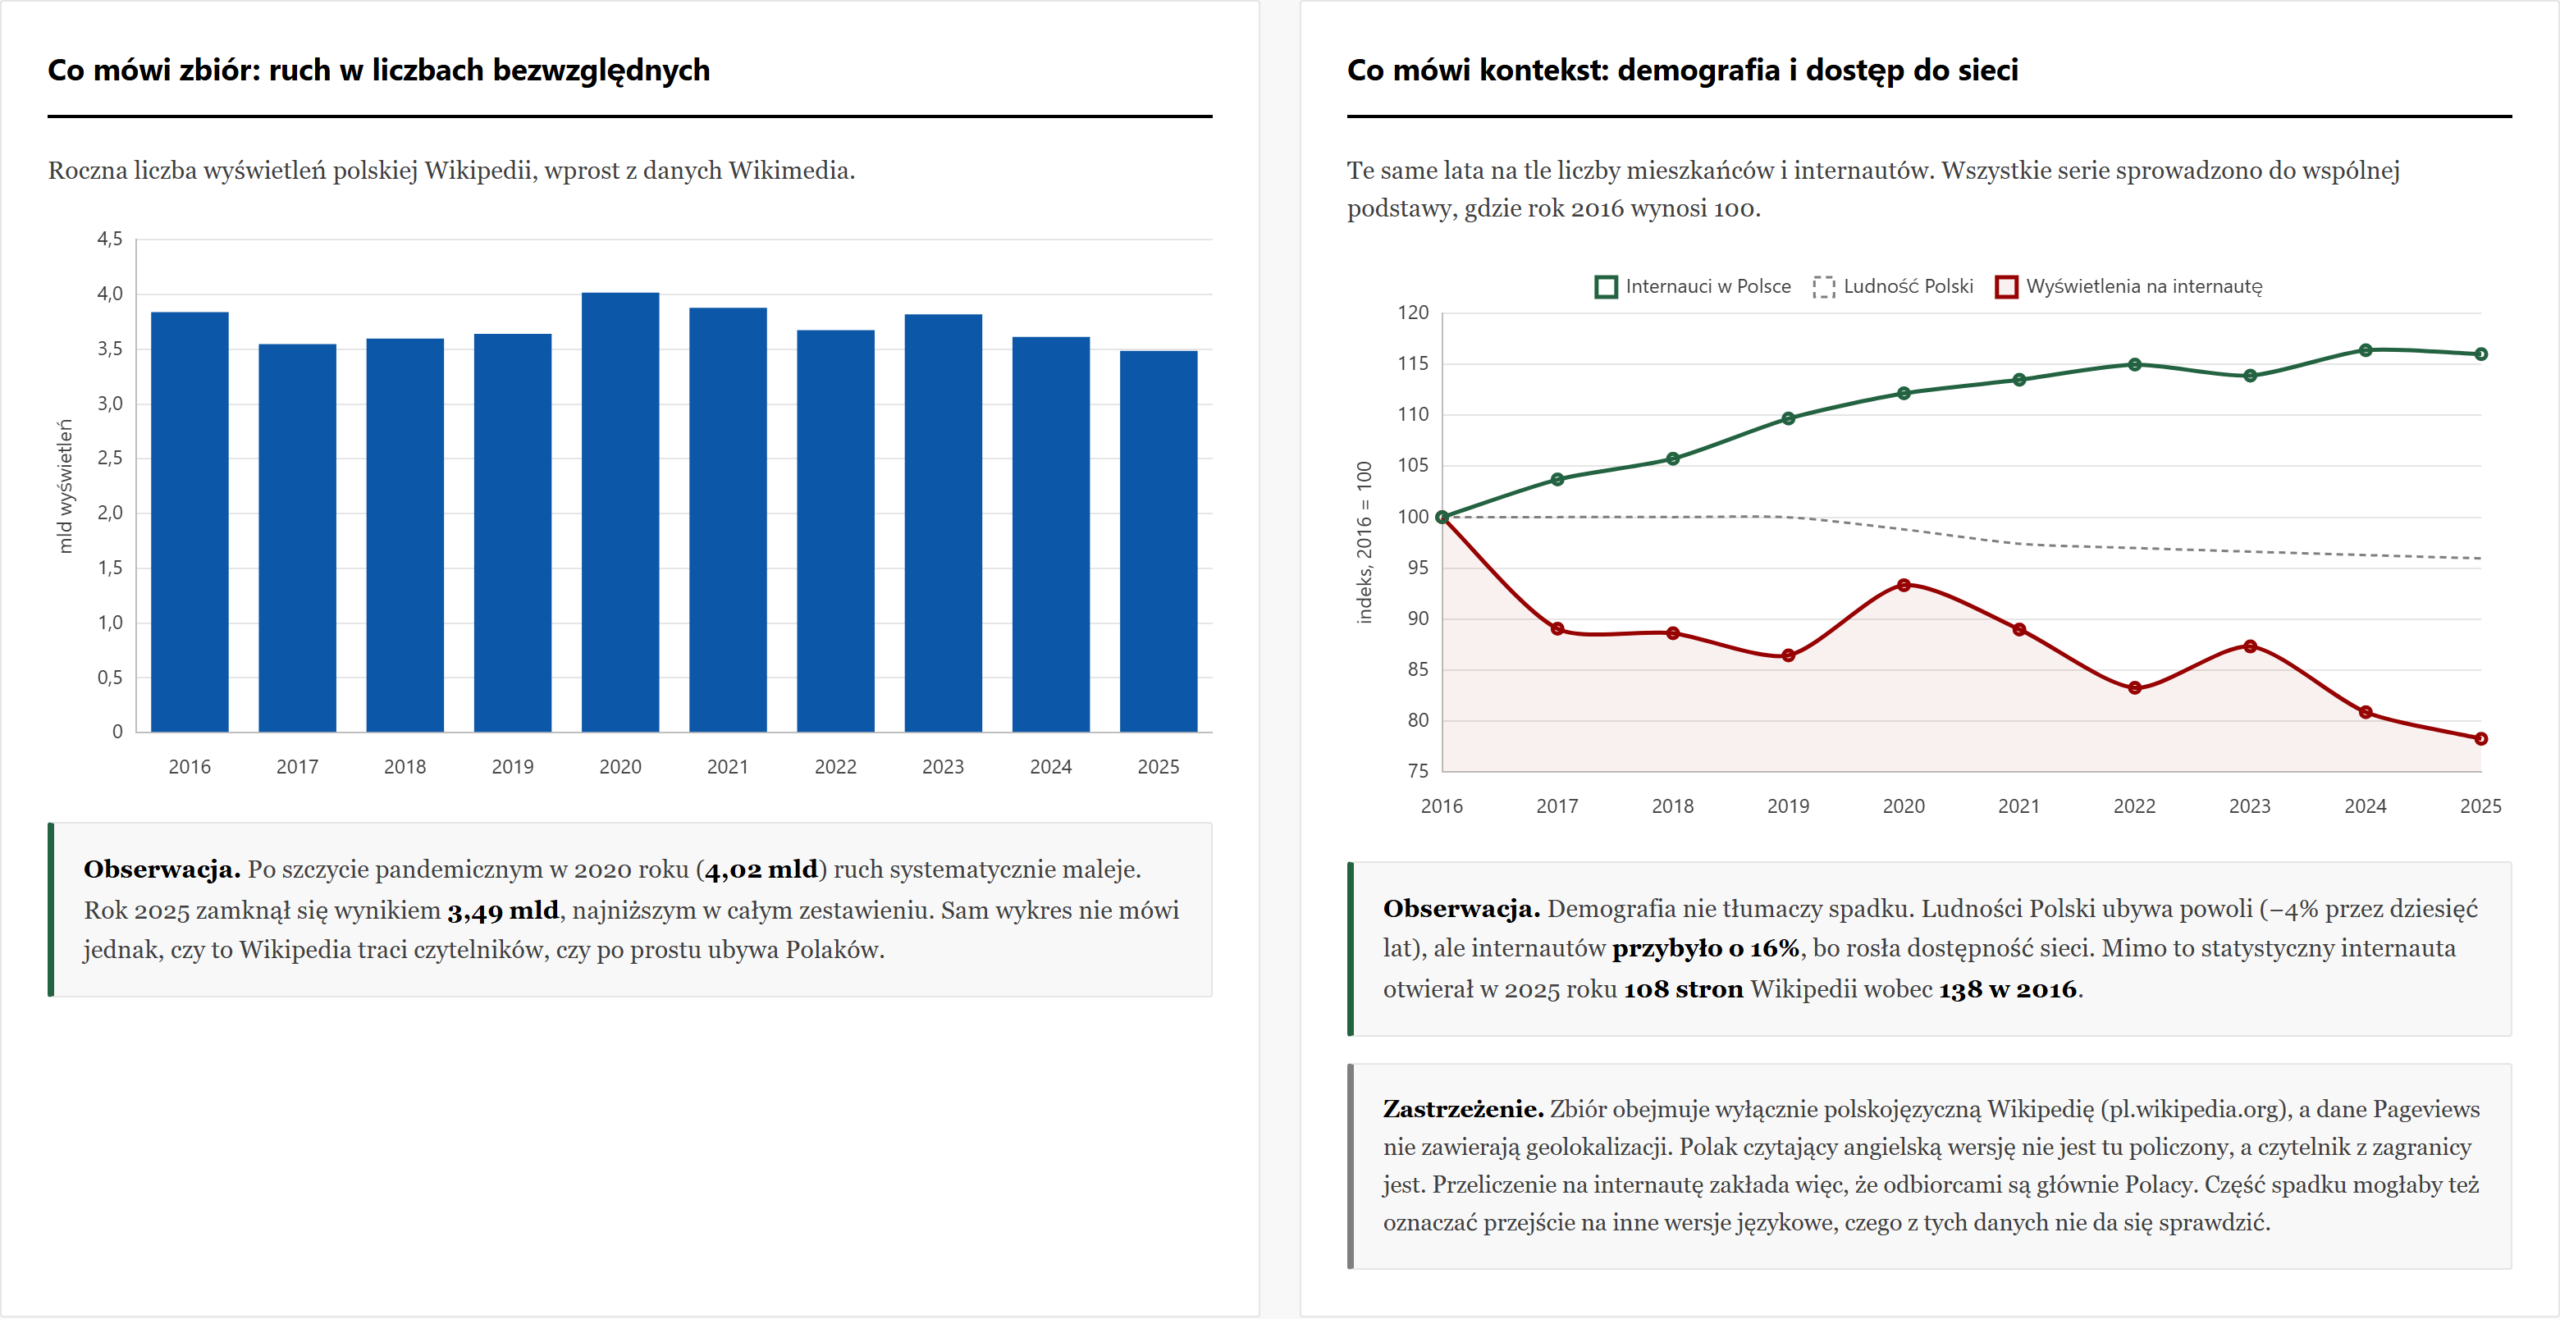
The result surprised me. The population is indeed shrinking, by 4% over the decade. But the number of internet users grew by 16% in the same period, because connectivity improved. Despite that, the average Polish internet user opened 108 Wikipedia pages in 2025, down from 138 in 2016. A drop of 21.7% per person.
So Wikipedia is not losing out because there are fewer of us. It is losing out because each of us reaches for it less often.
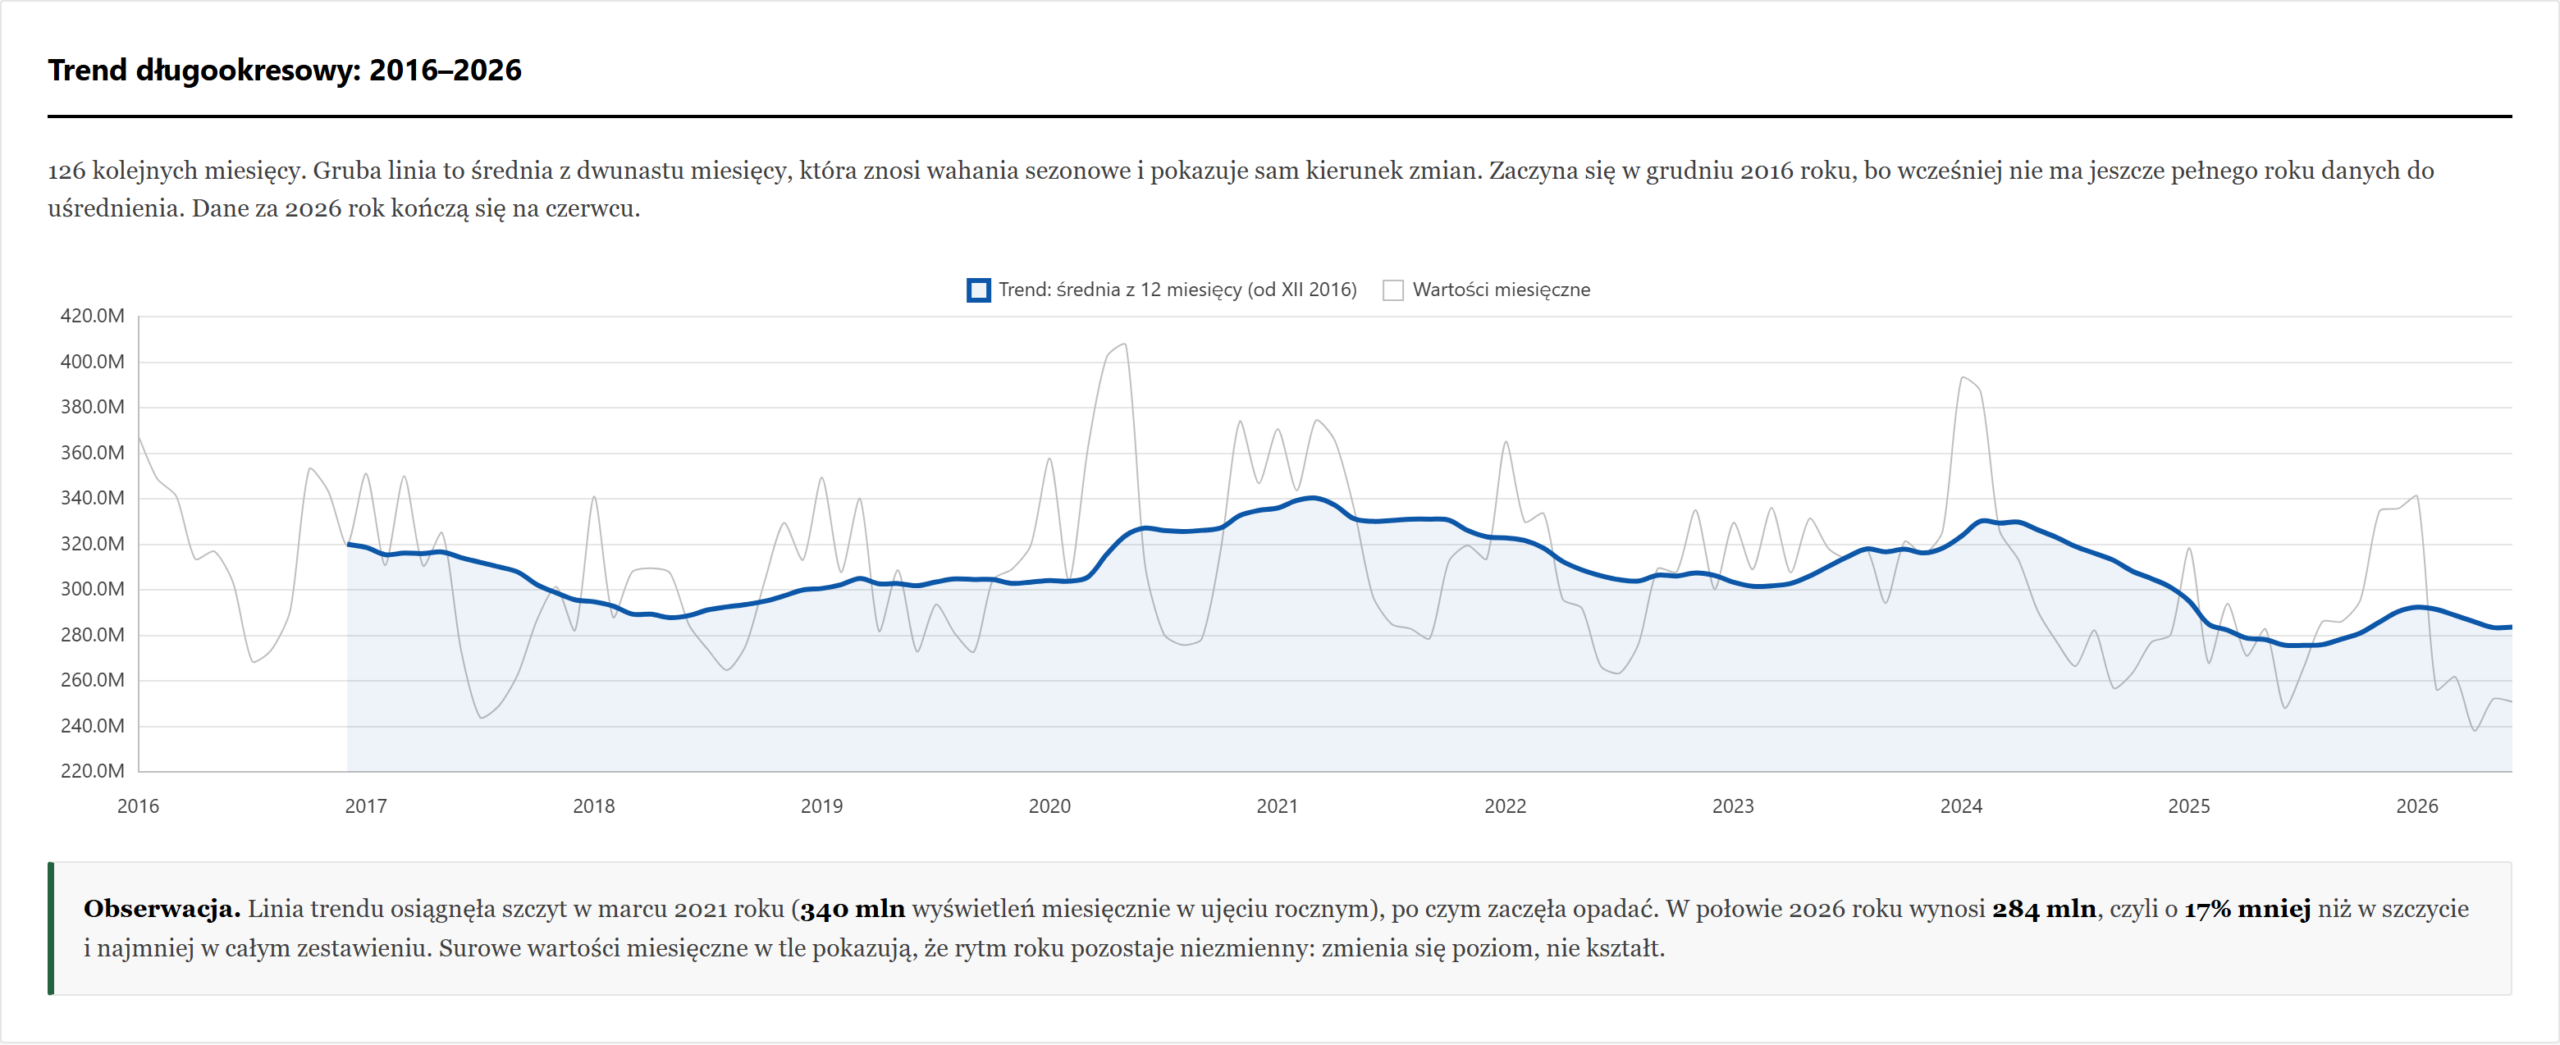
I first drew the long-term trend the obvious way: 126 monthly points on a single line. The result was a dense sawtooth that showed nothing at all. Seasonality is so strong that it drowned out the direction of change.
So I layered a twelve-month moving average on top. Each point covers a full year, so seasonal swings cancel out and only the trend remains:
const WINDOW = 12;
const movingAvg = data.map((_, i) => {
    if (i < WINDOW - 1) return null;
    let sum = 0;
    for (let k = i - WINDOW + 1; k <= i; k++) sum += data[k].total;
    return sum / WINDOW;
});
Only then was it clear that the trend peaked in March 2021 and has been falling since. I kept the raw values in the background as a faint line, so as not to hide what the data actually looks like.
Finally I tested what everyone says these days: that AI answers in search are to blame. Google shows a ready answer above the results, so nobody clicks through to Wikipedia any more. It sounds plausible.
I first ran the numbers from memory, assuming AI Overviews launched in May 2024. It looked beautiful: the decline started right after that date. Then I checked, and it turned out May 2024 applied only to the United States. In Poland the feature launched on 25 March 2025.
With the correct date the picture reverses. The steepest drops came in autumn 2024 and early 2025, six months before the launch. Comparing the twelve months before and after that date gives -14.3% versus +2.3%. I also checked whether this depends on the chosen period: for every start year from 2016 to 2024 the direction is the same.
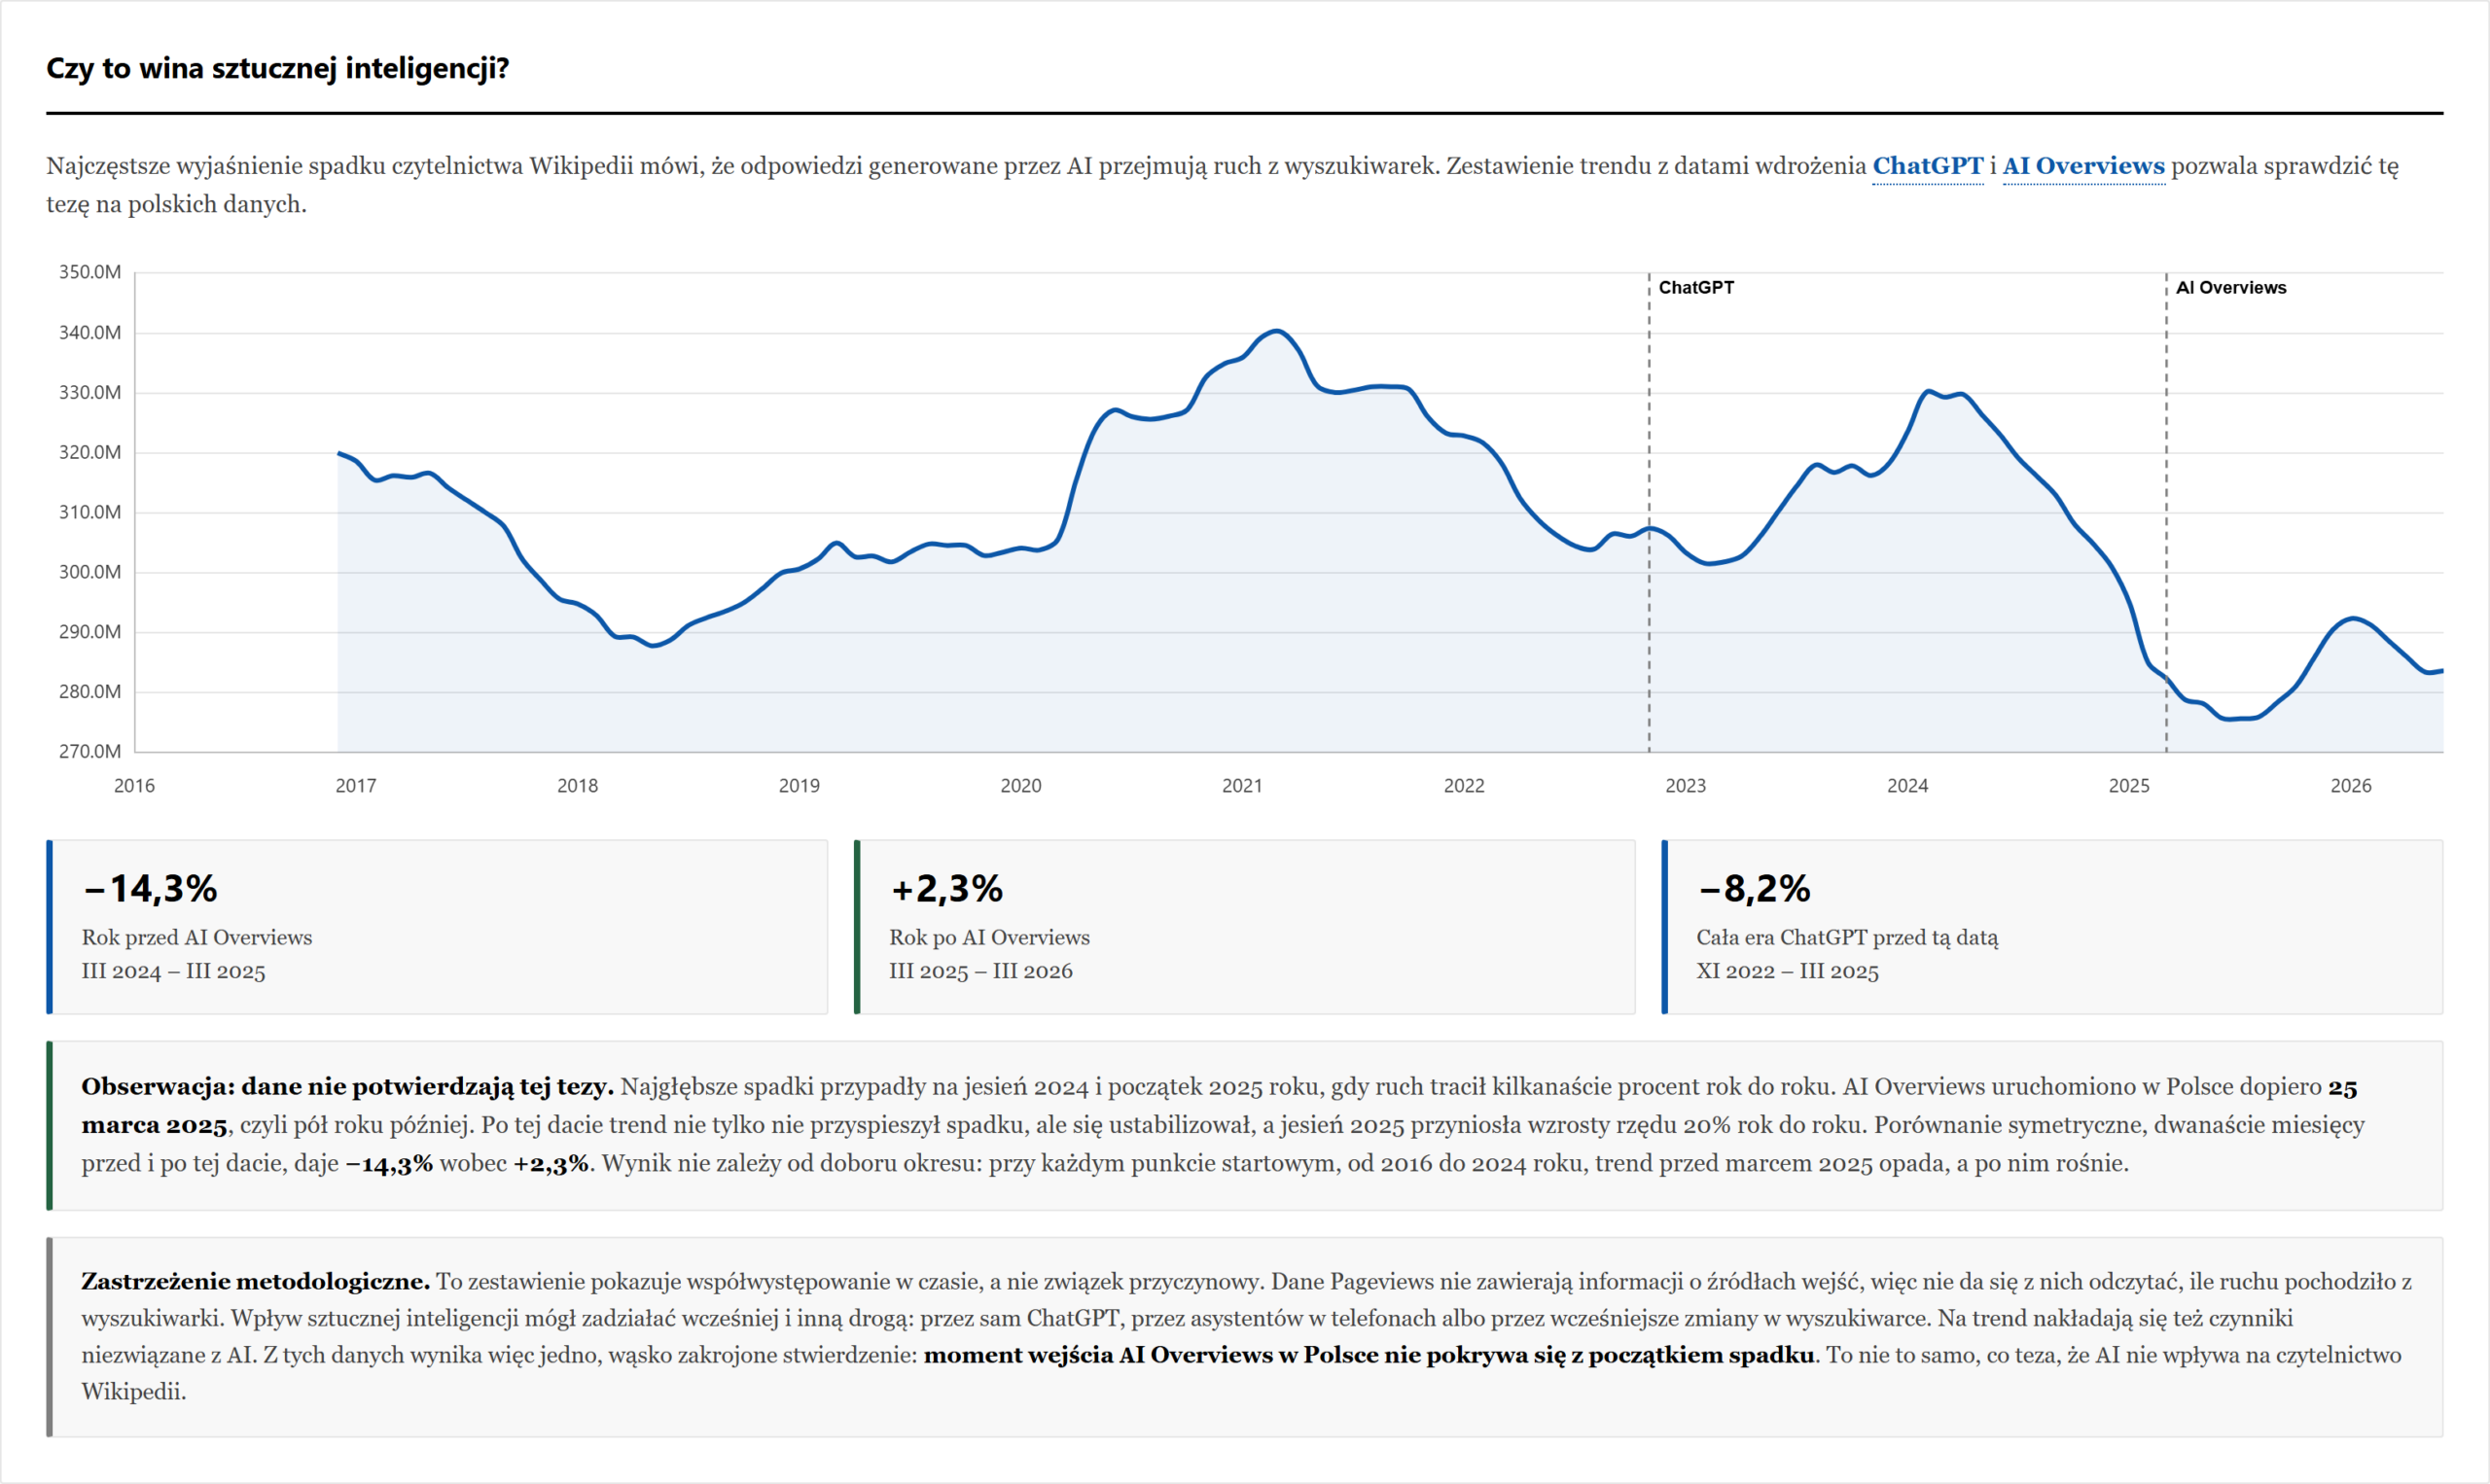
I left this on the dashboard together with a caveat that cannot be argued away. Pageviews data carries no referrer information, so it cannot show how much traffic came from search. These numbers support one narrow statement: the launch date of AI Overviews in Poland does not coincide with the start of the decline. That is not the same as claiming AI has no effect.
The data for 2026 ends in June. Including it in the seasonal averages would have understated February and March by roughly 2%. I excluded it from the averaging and from the device chart, and marked the missing months in the heatmap as no data rather than zero.
The same applies to internet penetration: the 2025 figure had not been published yet, so I carried forward the 2024 value. That is a conservative assumption, because continued growth would make the per-user decline even steeper. I wrote this in the footer rather than pretending the number was certain.
One thing I had to correct outright. In the first version I wrote that desktop was rebounding, because its share rose from 39.4% to 44%. Then I calculated the absolute values: desktop grew by 1.9% while mobile fell by 15.8%. The share rose because mobile traffic shrank faster, not because people returned to computers. That is a completely different story, and it is now described as such.
The contest required compliance with Wikimedia’s visual identity, so the dashboard uses the Core palette with Legacy AAA accents and the Montserrat and Source Serif 4 typefaces. I calculated the contrast of every text and background combination, with 4.62:1 as the minimum.
Fonts, logos and the Chart.js library itself are hosted locally. Not on principle, but because the original Chart.js CDN address started returning 404 and the whole dashboard stopped rendering. Now it depends on nobody else’s server.
The dashboard presents five views: seasonality, the decade of device share, the trend with its moving average, the comparison against demographics, and the test of the AI hypothesis. It works on phones, charts open fullscreen, and technical terms have explanations reachable by keyboard too.
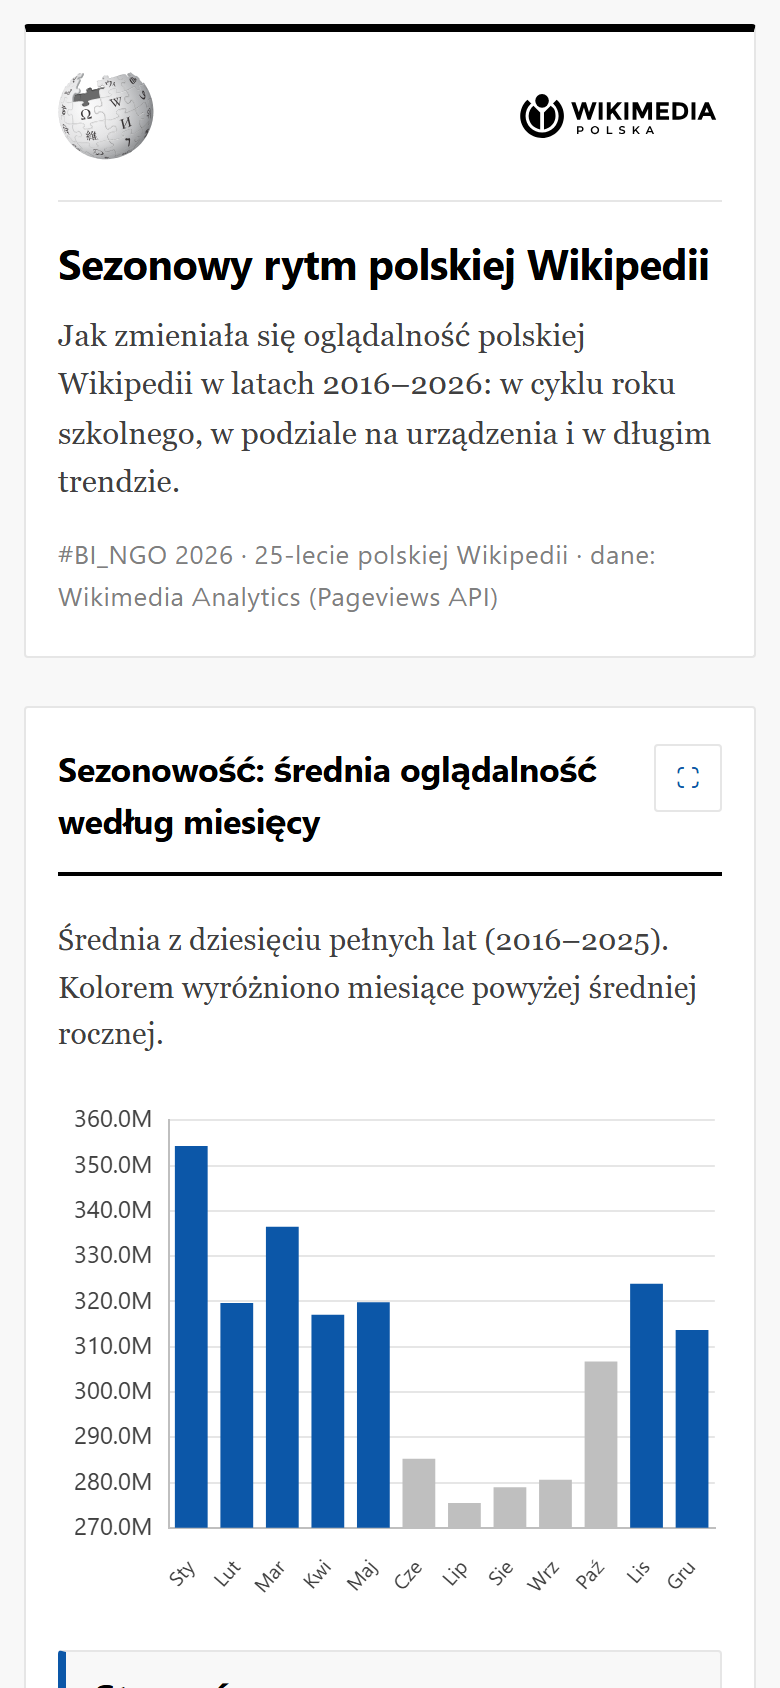
The strongest finding is not about seasonality, where I started. It is that the growing number of internet users and the falling readership diverge on the chart in a way demographics cannot explain. And the popular explanation for that divergence does not hold up against Polish data.
This was volunteer work, so there is no client who saved money here. There is something else instead: a demonstration that it pays to test your own hypothesis before announcing a conclusion. My first version of the AI analysis was striking and wrong. Verifying a single date was all it took.
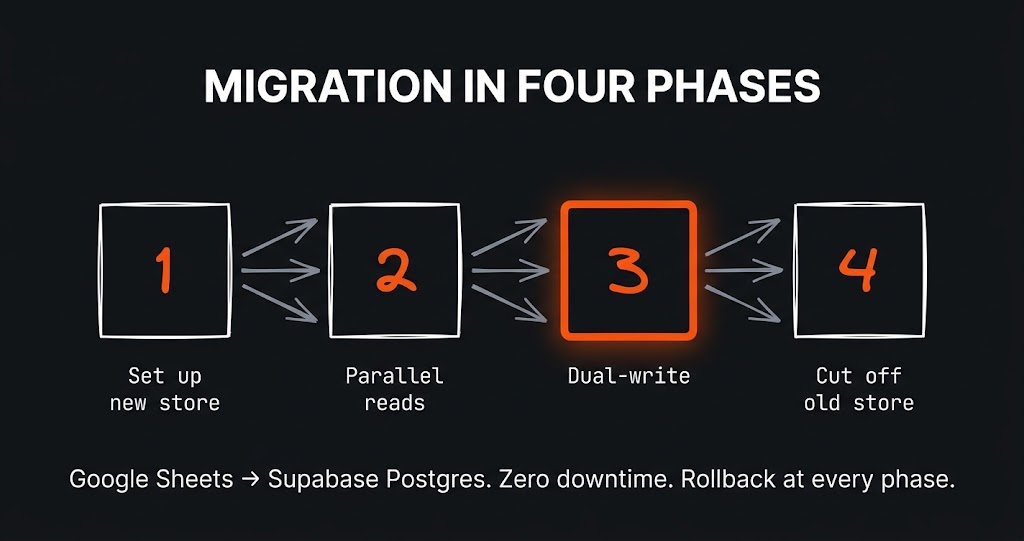
The challenge The app had grown alongside the business for a year and a half. It started as a clever Google Sheet with a few scripts…
The challenge How do you present data about dog homelessness so that people actually want to read it? That was my challenge. In March…
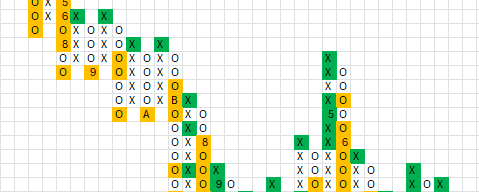
The challenge Picture a stock market analyst and his most precious tool – a proprietary method for analysing companies, refined over years. Now picture…
Just tell me what you need - it does not have to be technical, that is my job. I will get back to you and tell you straight whether and how I can help.